Gain new business insight with the new TeamUp dashboard
March 5, 2024
1
minutes
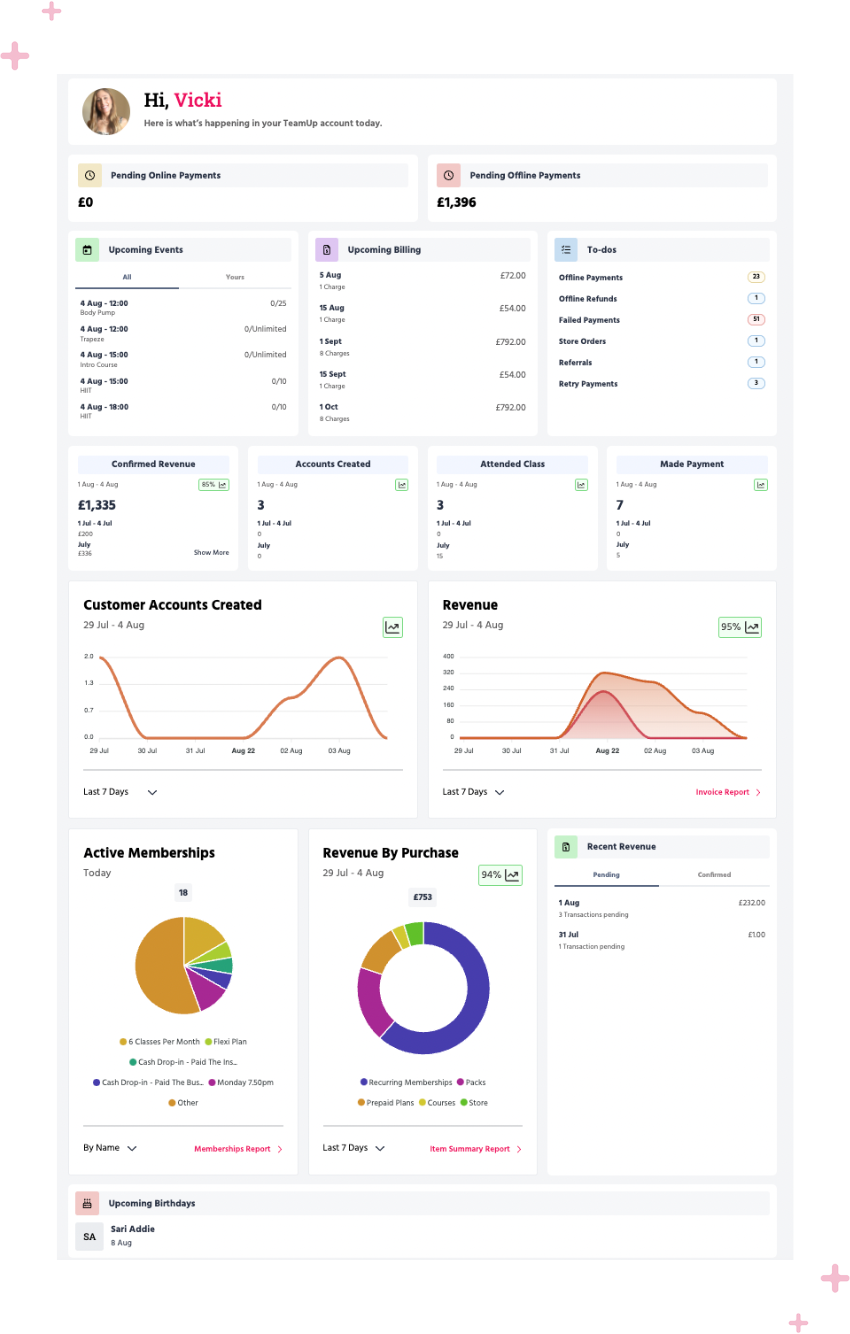
We're very excited to share that your TeamUp dashboard has been updated to make understanding the current happenings in your business easier than ever. With brand new data, a fresh visual design, and quicker navigation you can get a stronger pulse on the state of your business in one snapshot.
But that's not all!
Your dashboard is now navigable with new animated charts and tables, to make reviewing everything from upcoming events and registrations to your revenue streams to your customer journeys extra visual and clear.
Each chart and table highlights daily figures and stats and makes comparisons to previous time periods as well as includes growth insights you can use to identify trends and make business projections.
To understand these new insights and how to use your charts and tables, here’s a breakdown of what’s new to your dashboard.
A new design and visuals
The new dashboard design displays your data through helpful visuals, graphs, and charts that make it easier to understand key activities happening in your business. The colourful design is not only more visually appealing but can help you quickly identify key metrics.
Using the dashboard's new easy navigation you can toggle between dates, time periods, and metrics for more in-depth insights without having to leave the page.
Growth insights

Within each dashboard report, a percentage icon shows you your business’s growth in that specific area in comparison to a previous time period. For example, if you are looking at the last seven days it will compare it to the seven days before.
You can use this data to set goals and track your trajectory for months to come and make data-driven decisions for your business.
Revenue and customer account charts
You now have an expanded view of the revenue and customer account charts to see up to three months of data in a clean visual way.
In your customer account chart, when you select today's view you'll be able to see data up to the hour at which a new account is created for even deeper insight.
In your revenue chart, you can toggle between the time periods to see pending revenue confirmed revenue on a certain date.
The growth insights update depending on the time period you are reviewing which will help you identify weekly, monthly, and quarterly trends in your new accounts and revenue.
Active memberships chart
The Active Memberships pie chart report displays the breakdown of your membership types and the number of each type currently active as of the current date. This helps you get a pulse check on the current state of your business.
View the chart "By Name" to see a breakdown by membership name or "By Type" for a higher level breakdown based on the type of membership such as a recurring, pack or pre-paid membership.
Revenue by purchase chart
Similar to the pie chart, in the Revenue, by Purchase report you'll be able to quickly identify your biggest revenue streams. You can use the time period filter to compare to up to three months prior, as well as navigate to the Item Summary Report for itemized details.
When you hover over the chart, you'll be able to see the percentage of overall revenue that that specific revenue stream accounts for during the specific time period you view.
Recent revenue table
The Recent Revenue table highlights the most recent pending and confirmed revenue coming into the business in a split view to easier identify your recent revenue's status and transactions.
Upcoming birthdays
The previous upcoming birthdays' report showed you birthdays within 2 days. The new report shows you upcoming birthdays for the entire month, giving you even more time to prepare something special for your customers.
Staff permissions
If your staff or team do not have full access to TeamUp they might not be able to see the dashboard based on the permissions you have set. If you'd like to give them a more in-depth look at your business and access to the dashboard, you can edit their permissions settings in the staff management section.
Video guides
For an in-depth overview of your entire dashboard and its data and reports, check out our new help center guide. You can also watch this video for a full overview of the new dashboard and watch this video for a side-by-side comparison of the old and new dashboards.
We can't wait to hear your feedback. To refresh on what's recently new to TeamUp, check out our what's new section.

Ready to scale your fitness business?
Learn more about the #1 fitness management software for boutique fitness studios, gyms and franchises