How to track your website performance with Google Analytics
February 21, 2024
1
minutes
What is this article? This is part of our new marketing series helping fitness owners learn what they really need to know to market their businesses. This is guide #2 of 7. To find the other guides, return to the overview page, here.
After launching your website, your next step is to start tracking your website's popularity and traffic. Using a website traffic checker and web services such as Google Analytics can show you important data such as who is visiting your website, where they are visiting your website from, how they found your website, and what they are viewing.
In this guide, we are going to share the importance of tracking that information, what valuable lessons you can learn and decisions you can make using Google Analytics, and how to set up your account. Clare Eaton, owner of Feel Good Health and Fitness is back to share her Google Analytics traffic for her brand new website. Let's get started.
What is Google Analytics? Tracking traffic to your website
Google Analytics is one of the most popular free tools for tracking the people visiting your website, otherwise known as website traffic. It can gather data on desktops, mobile devices, and tablet apps making tracking traffic more accessible. Google Analytics includes all types of figures and metrics that you can view to see what is going on in your website and what people are coming to your website looking for.
You only need one account for your entire business and only need to set it up once for it to start working for you.
Google Analytics simply works like this
- You open a Google Analytics account and add your website link.
- People come to your website.
- Google tracks what they do.
- Google gives you that information in your Google Analytics account.
- You can use it to learn about your website and who is visiting it.
It's really as simple as that.
But...before you start wondering if is tracking the actual people visiting your website, we'll stop you there. Google Analytics tracks their actions, meaning that when a person comes to your website from anywhere online via Google itself, an app, social media, or another website where your business and website are mentioned, it will tell you along with the information it knows about from where, why, and how.
Using this information you can make important business decisions and improve your marketing strategies to ensure you are targeting the right markets and areas.
Why should I listen to Google Analytics?
Google Analytics serves one major purpose and that's to help you make important and better decisions for your business. Supported by real-time actual data, it gives you page insights such as being able to see exactly what people like about your website, whether they are using it to book your classes, and what you can do to ensure customers find you. It's one thing to make decisions based on what you think will work, but when you have a free tool that can show you, you'll be in much better shape.
Is Google Analytics easy to use?
It sure can be! There are so many different options and things to track using Google Analytics. But when it comes to getting the data you need right now, there are some key areas you can focus on, and save the rest for down the road as you get more comfortable using the tool.
What can Google Analytics show me?
Your Google Analytics will provide you with several useful reports that you can use to track the most important information Google has to offer. To make it simple for you, we will break down those reports, and you can find a glossary of the terms we mention at the end of this guide. We used an overview of Clare's data from the first month her website was live. Those reports are:
Audience overview
The audience report tells you everything you need to know about your website visits. You can see if they are new or returning, how long they stay on your website, what their average bounce rate is, and what pages they view, all of this information can be found in this report.

Keep reading to find out more about the information you need from Google Analytics
Real-time report
The real-time report tells you how many active users are on your website and on your top active pages. You'll also be able to see how long your website visitors usually visit your website.

Acquisition report
Your acquisition report tells you where your website visitors are coming from. Directly to your website, via social media, or via organic searches on search engines such as Google, Yahoo, or Bing. You can also see if they came to your website by specific social media pages, or by referrals from other websites.


Location overview
The location overview gives you insight as to where your website visitors are actually coming from, by location: country or city.


Pages report
The pages report tells you the pages your website visitors visit and interact with details such as how long, bounce rate, and new or returning user.


Mobile overview
The mobile overview tells you what devices do your website visitors use to find your website, mobile, tablet, or desktop and the breakdown.


Active users report
The active users report how your active users were trending over periods of time and how many users have visited your site.

Cohort analysis report
This report tells you how well you retained your website visitors over periods of time, meaning whether or not they came back to your website within a period of time.


Once your account is set up you'll be able to use these reports to monitor your website activity and better understand your target markets and how to achieve your goals.
Find out how to open a google analytics account
Opening your Google Analytics account
Now that you know what Google Analytics can do for you, your website, and your business, it's time to open your account. You can start, here. If you don't yet have a Google Account, you must first create one to access Google Analytics.
Once you have signed up you'll be prompted to start measuring your account and to set it up. We will be using Clare Eaton's Google Analytics account as our example.
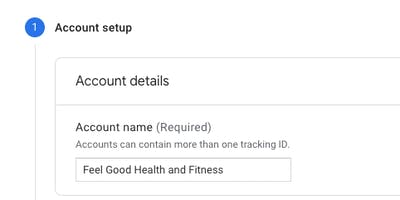
You will need to put:
- Your account name, ie: Feel Good Health and Fitness
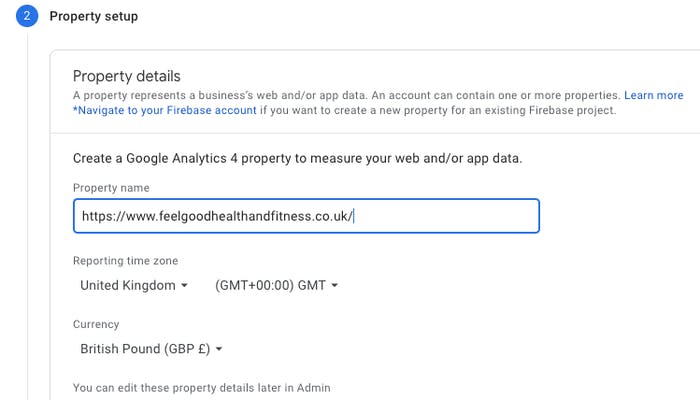
- Property details, ie: https://www.feelgoodhealthandfitness.co.uk/
- Your time zone and currency (which is used to track goals)
- And fill out the About my business form which will ask for details such as what you want to measure, how large your business is

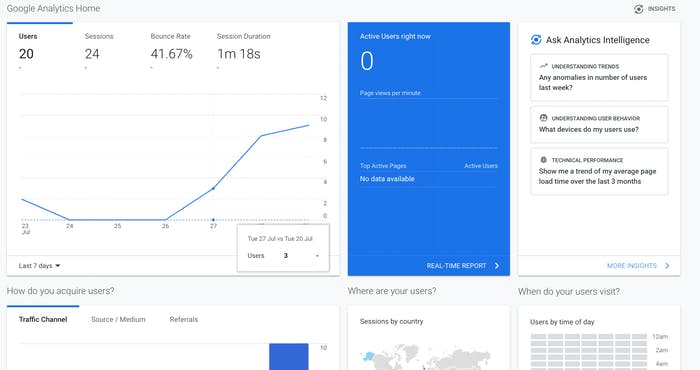
Google Analytics Home
Your Google Analytics Home dashboard is your quick insight into what is going on in your business and gives you a snapshot of the reports we discussed above.
From your home page or using the left sidebar, you can navigate your reports and investigate specific behaviours of your website visitors.
How to set up Google Analytics with TeamUp
We understand that Google Analytics can be a little complicated at first to use and navigate. Fortunately, we're here to help you. Not only can Google Analytics help you better understand your website, but it can help you track your conversion rate or the people who visit your website and then go on to book a class or sign up for a membership. Using Google Analytics you can set goals that you would like your customers to complete, for example:
- Purchasing a membership plan
- Filling out your contact form
- Viewing your on-demand content
- Checking out your new class list
- Reading your blogs
- Spending a specific amount on their membership
and so on. As this is an advanced feature, our customer support team needs to integrate your account for you, but it's quick easy, and won't take us any time at all. If you would like to integrate your TeamUp account and Google Analytics account to set up the goals and track your conversion rates y, please follow the steps in our guides here:
Additional free and paid tools you can use to monitor your website's traffic and growth:
Alongside Google Analytics, there are other platforms you can also use to monitor and track the growth of different aspects of your website.
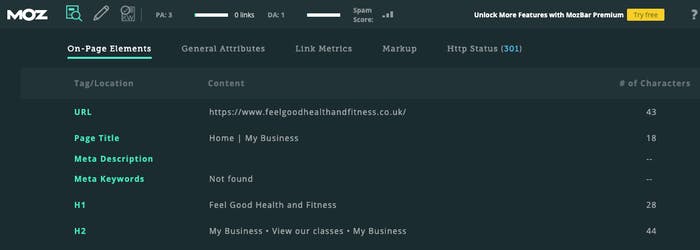
Mozbar
MozBar is a free Google Chrome Extension, that offers both a free and paid (MozPro) subscription. MozBar shares important link metrics for your website such as Domain Authority, Page Authority, and backlinks to your website. As your website grows and you include elements such as internal and external links, follow and no-follow links, and meta tags, MozBar can help you monitor the increase in your website's relevancy on popular search engines such as Google.
Google Trends
Google Trends is a free Google application that helps you track the most relevant and trending topics being searched on the web daily. Use Google Trends to search popular terms for your business type, see what other people are searching for, and which keywords are most relevant to use in your own website and content in order for organic traffic to be driven to your website.

SEMrush
SEMrush is one of the most used tools in SEO. For anyone starting out on their SEO journey, we wouldn't recommend SEMrushing into signing up for an account, partly due to the price with plans starting at $100 per month, but also because tools like keyword planner are a good starting off point and sufficient enough if you're just looking to improve your Google rankings by creating SEO-strong content.
When you become more proficient in SEO and your website starts to grow, then investing in a tool like SEMrush will actually prove very useful. You can track all facets of your page's SEO from bounce rates and views to specific keywords and phrases that you've been implementing on your website and much more. Plans start at $100/month.

Google Alerts
Google Alerts is another free Google application where you can set up alerts to be sent directly to your email inbox anytime a term or keywords, such as your business's name, are mentioned in an online news article, blog post, website, discussion, and so on. You can even go as far as to track the alerts for a specific region and language and receive only the most relevant alerts or all.

Google Analytics glossary
We could provide you with a dictionary long guide of the terms, features, and reports Google Analytics can show you, but when it comes to you and your business right now, these are the most important metrics to track and things to look out for in each report:
- Number of page sessions - Every time someone visits your website for a certain amount of time, Google picks it up and adds it to your analytics. Sessions can help you see which of your pages your website visitors spend the most amount of time on, therefore, what they are viewing the most.
- Page views and number of page views - Page views will tell you when a person is actively viewing your website and will label that as one view. The number of page views will tell you how many times one of the pages on your website was viewed. A high number of page views usually means that people who came to your website really liked what they found and explored more. A low number of page views means you might need to do a little more work on that page or include it in more of your marketing content if you want people to view it.
- Bounce rates - Bounce rates are when a person visits your website or a page on your website and quickly leaves. This is usually a sign that someone came to your website and it wasn't what they were looking for or quickly realised it didn't have what they wanted. A high bounce rate is a good indicator you might need to improve your content or work on your marketing.
- Referrals - When another website or your social media pages link to your website and people click on that link to arrive at your website, Google tracks that as a referral. The more you get your website featured on online publications, blogs, and social media, the higher your referral stats will be.
- Average session duration - The amount of time a person spends on a page of your website is a good indicator of whether or not they are reading the content on the page. Use this report to see which pages have low or high averages and use those stats to review and improve if need be.
- Sessions by channel - The sessions by channel report will tell you if a website visitor came because they searched your website, clicked on one of your links, found your website by browsing the web. You can use this report to see if you where you need to invest more of your marketing efforts. At the start of building your website, it is more common that your website's traffic will be direct, but as it gains in popularity and you improve your website you will see your organic traffic begin to increase.
- Top locations - See the top cities that people are visiting your website are from. No matter whether you offer your services in-person or online, knowing where your visitors are coming from can help you see what areas and markets your services are attractive in, and where you should drive more of your marketing efforts.
- Goal completions - You can set goals within Google Analytics and the goal completions report will show you what customers are doing on your website and if you hit those goals.
- Top social traffic - If you share your website link on your social media pages, the top social traffic report can tell you which social channel is sending the most traffic. You can use that information to put more effort marketing effort into your channels or focus on the ones that are driving you the most visits.
- Trends and patterns - Not only can you learn about where your customers are coming from and how they are finding your website, but Google Analytics can also use that data to identify popular trends and patterns occurring on your website and on similar websites. Using this data you can boost your website to make sure you are taking advantage of those trends and delivering the content and services your visitors are commonly searching for.
Next steps: building your SEO strategy
Once your website and Google Analytics account are up and running, the next step is to build your SEO strategy which includes adding highly searched keywords and adding content to your website. In the next guide, we will discuss how to find these keywords, use the information you already know is used to find your business, and how to implement a regular content schedule. Start reading guide #3, here.

Ready to scale your fitness business?
Learn more about the #1 fitness management software for boutique fitness studios, gyms and franchises
.png)

